I conducted research on all 441 USDT trading pair listings on the Binance spot exchange and will now share the results with you. Additionally, I will debunk a significant number of misconceptions associated with the listing’s first day.
Disclaimer
I assert that neither I nor anyone else knows what will happen in the market tomorrow. This research reflects my personal opinion. I do not offer investment advice and do not advocate for buying or selling tokens based on the research findings.
This study is founded on historical data spanning the last 6.5 years, dating back to the initial listing on Binance. Past performance does not guarantee future outcomes.
Why do you need to read this?
I am illustrating patterns that traders and investors can leverage.
Investors
The study reveals the outcomes of buying tokens on the exchange on the listing day or in the subsequent days using a “buy and hold” strategy.
Traders
The research showcases various trading strategy options in the early days of listing. It also includes backtests of these strategies.
Data Set
Currently, there are 382 USDT pairs being traded on the Binance spot exchange. These include BTCUSDT, ETHUSDT, BNBUSDT, and so forth.
You can access the complete list of tickers in our crypto screener:
https://cryptotradinglab.com/screener/binance/spot?q=USDT&m=tkrs
For this research, I also included around 100 pairs that have undergone delisting to prevent survivorship bias
The study excludes:
- Stablecoins
- Margin pairs DOWN, UP, BEAR, BULL. For instance, XRPBEARUSDT, XRPBULLUSDT, etc.
- Tokens WBTCUSDT, WBETHUSDT
Cost Impact
In any historical data testing, it’s crucial to consider the significant impact of costs on the final outcome. If you purchased a token at $100 and then sold it at the same price, the trade outcome is not zero. You experienced a loss due to the commission fee and slippage.
The entry fee typically ranges from 0.012% to 0.1%, and the exit fee is the same, depending on the trading volume, order type, etc.
Link: https://www.binance.com/en/fee/schedule
However, the advantage of low fees is counteracted by increased slippage resulting from the substantial trade volume.
This research does not factor in the fees. For instance, if the backtesting yields an average profit of 1.5% per trade, with fees and slippage considered, this profit may decrease to 1.2%-1.4% per trade.
Entry Point
For the initial entry point into a position, I consider the closing price of the first day of listing.
This practice is also widely used for analyzing the dynamics of new IPOs. Researchers often take the closing price of the daily candle on the listing day at the stock exchange as the entry point. Before we delve further, let’s explore other options.
Buying tokens a few days or weeks before the listing.
If you were indeed able to do so, you might anticipate significant profits in the hundreds or even thousands of percent. It could be due to exceptional expertise, insider information, or simply luck. However, such investors represent less than 0.01% of those reading this research.
Buying the token at the onset of trading on the exchange.
For example, if the listing begins at 2 p.m., this would entail buying precisely at 2 p.m. or within a minute, hour, and so forth.
The notion that you can acquire a token released on the Binance crypto exchange at a price close to the opening day is a prevalent misconception. Many experts fall into this pitfall. Why? Perhaps they have never attempted to buy a token at the listing moment.
Example
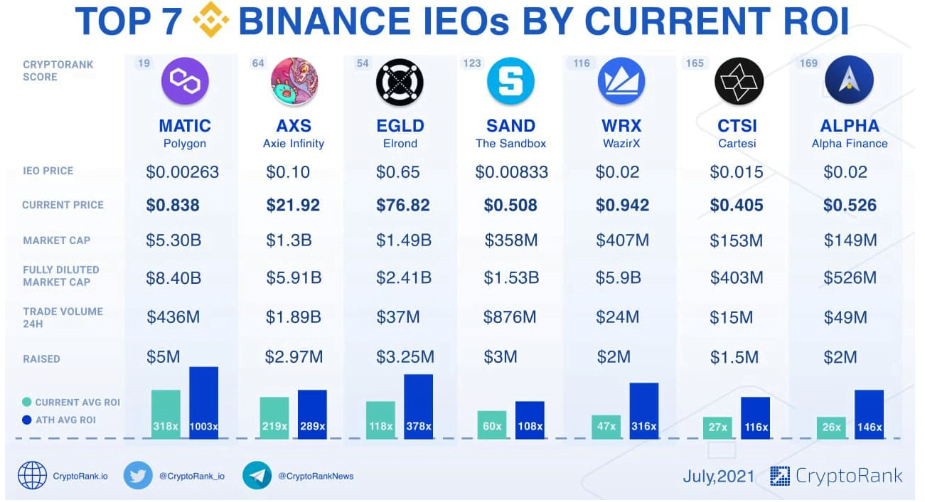
Source: CryptoRank.io
The visual appears highly promising! All that is required is to purchase the new token at the listing’s commencement and await its growth by 10 or even 100 times.
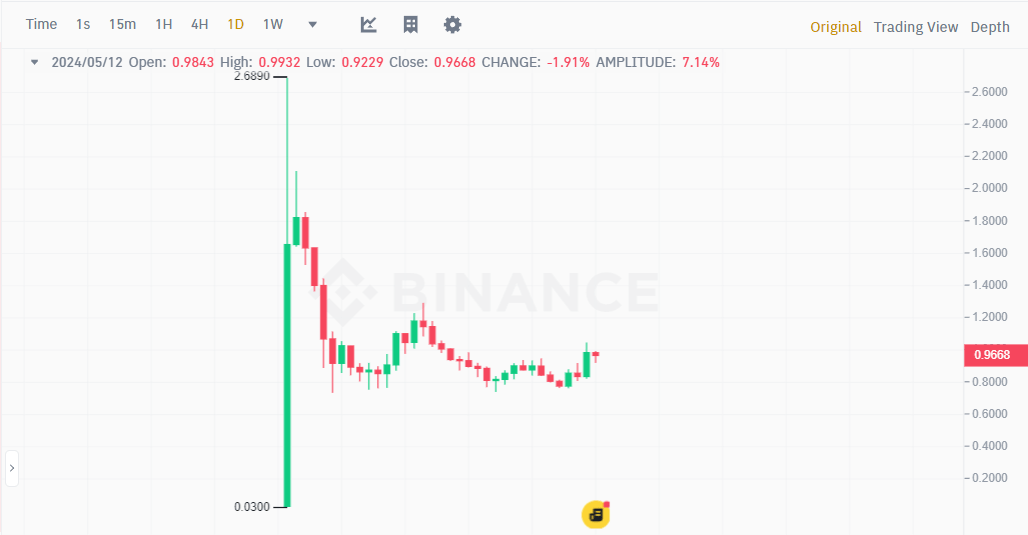
You can see the daily chart for the AXSUSDT pair down below.
The opening price of AXSUSDT on the listing day was $0.1. It closed the day at $0.146, showing a 46% increase.
And what if we examine the pair SANDUSDT?
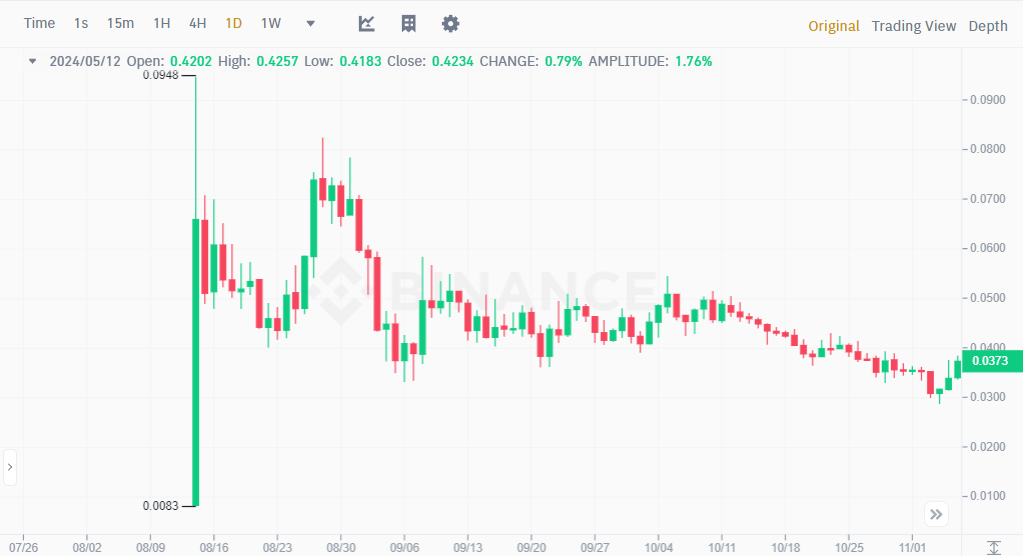
The opening price of SANDUSDT on the listing day was $0.0083. It closed the day at $0.066, marking a 695.18% increase.
Attention! An important question. Why do I suggest taking the closing price of the first day as the entry point for research? It’s easier to buy new tokens on the listing day at the opening price and potentially earn much higher profits.
Let’s dive right in.
The examples from the chart above are rightly named TOP 7 Binance IEOs by current ROI. However, I am examining all 441 listings, not just the best or worst performers.
Let’s explore how prices usually move on the listing day.
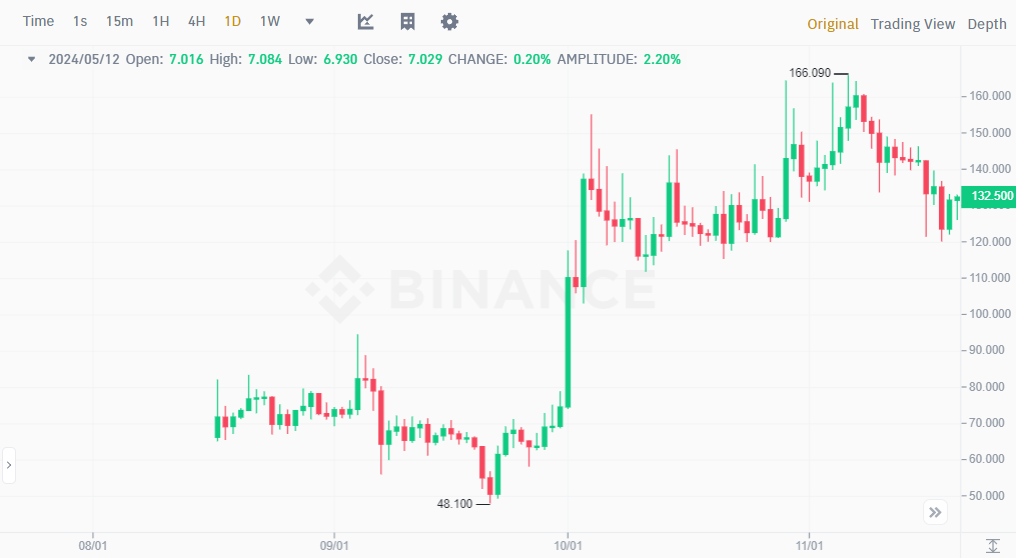
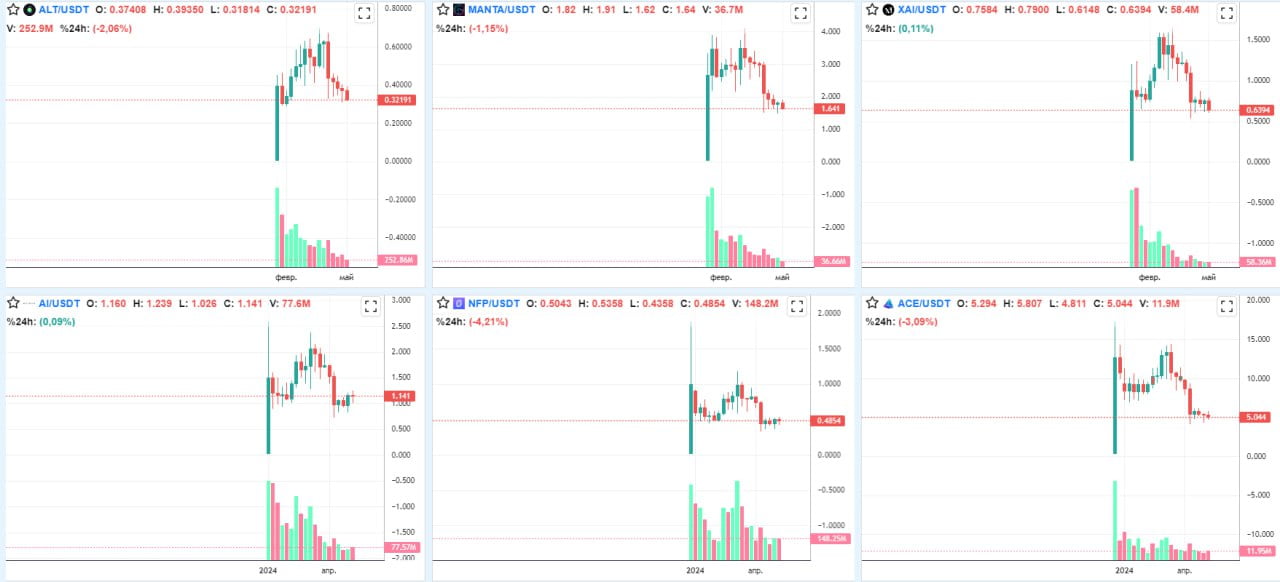
In the image below is the daily chart of the TNSRUSDT pair.
On April 8, 2024, the listing day, the TNSRUSDT pair opened at $0.03 and closed the day at $1.6558. The increase from opening to closing was 5426%. So, if you bought this pair for $1,000 at the opening of trading, you would have had $55,260 in your account by midday.
Is it really that easy? Warren Buffet, for decades, demonstrated returns near 20% annually and became an icon for investors. Doesn’t it seem like something is off here?
Let’s take a closer look.
We are unaware of how the price moved within the daily candle. Therefore, let’s switch to a smaller timeframe, such as 1 minute.
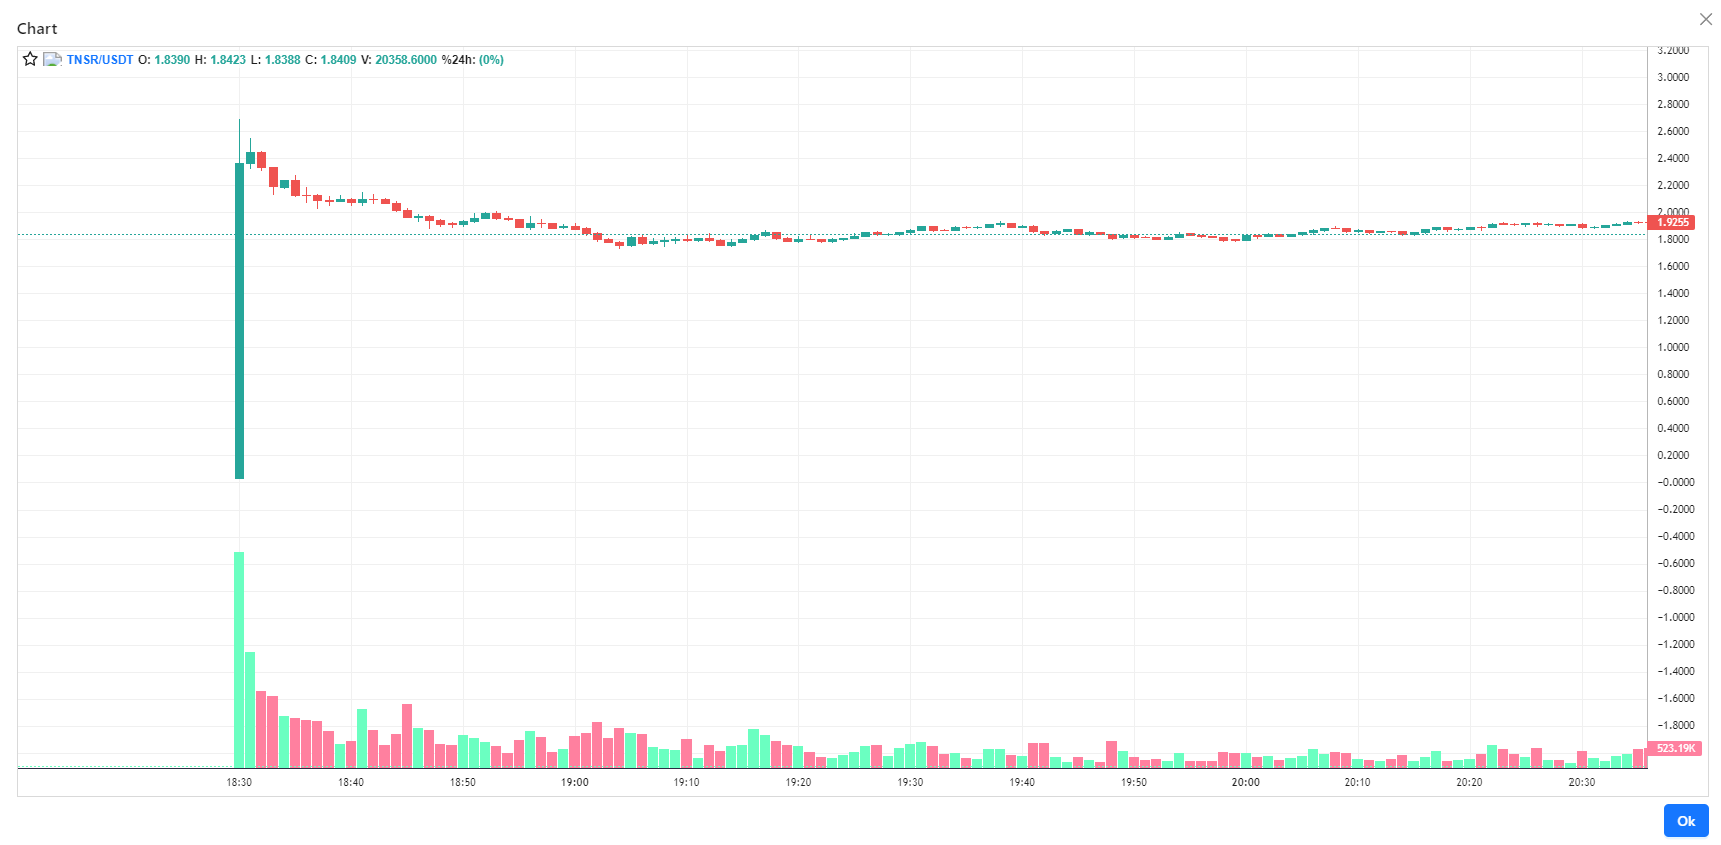
What do we observe? In the initial minute of trading, the price surged swiftly. The closure of the first 1-minute candle surpassed the day’s closing. I’m sure many of you have already figured out why you can’t become a millionaire.
But what if we could have purchased the TNSRUSDT pair within the first minute of trading, say at the 30-second mark? Even if it was pricier than the opening price of $0.03, there should still be substantial profit potential.
To test this assumption, we transition once more to a smaller timeframe, 1 second.
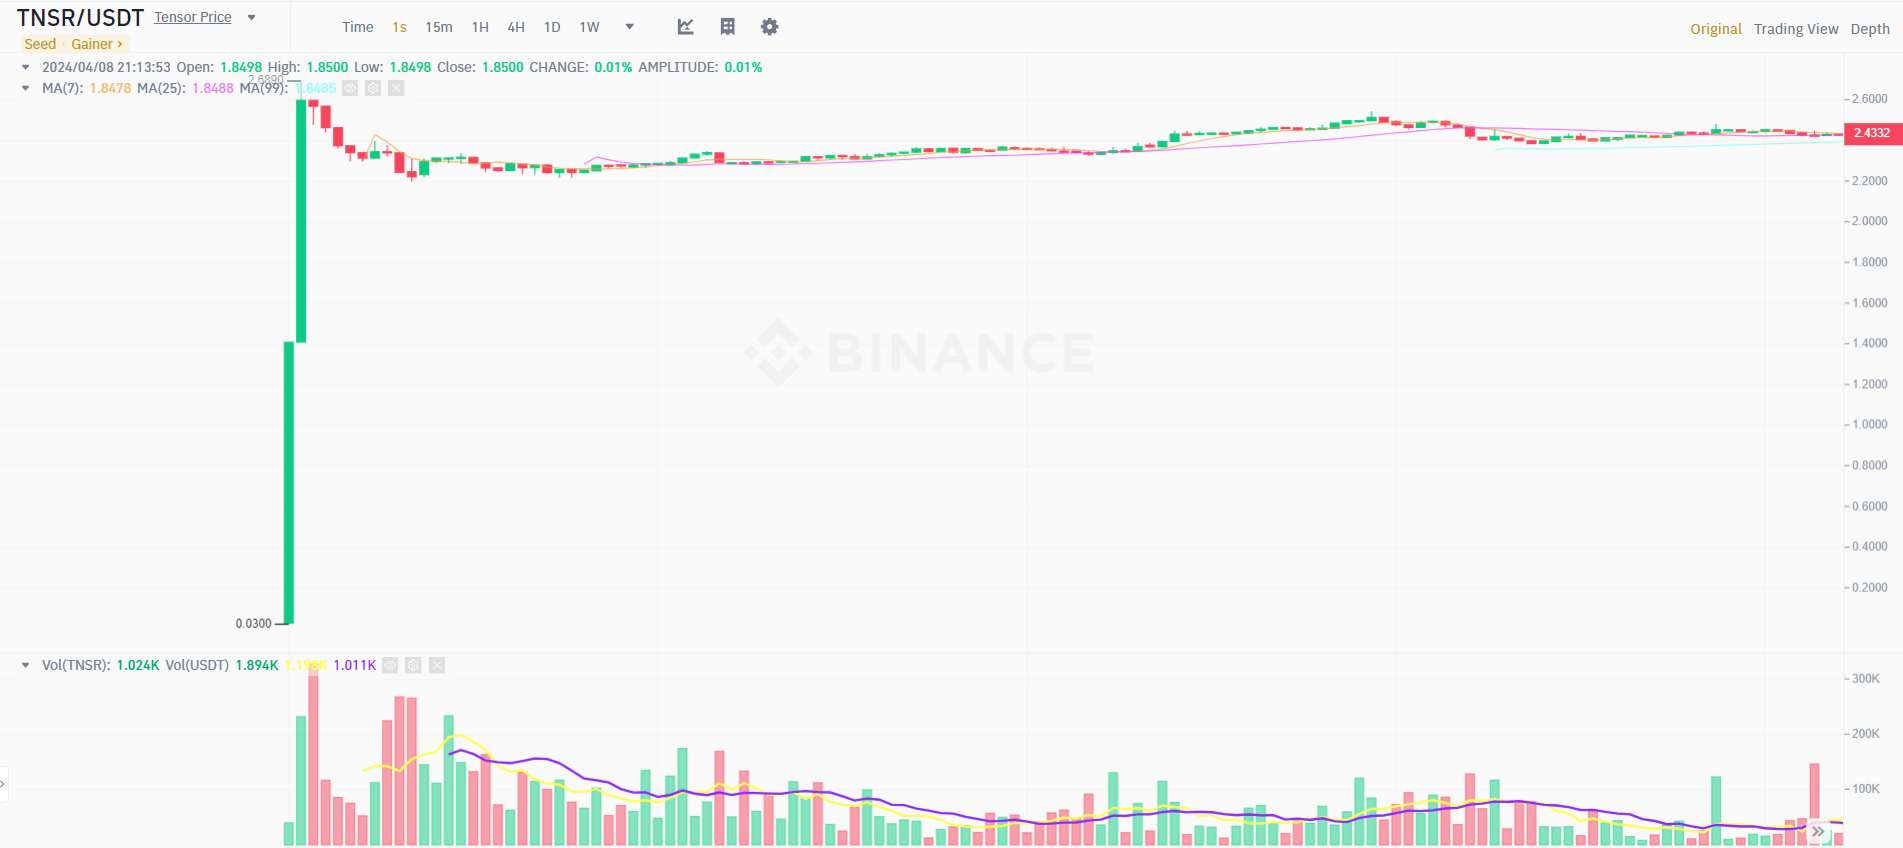
A chilling and sobering reality! Merely after the first second of trading, the price stood just 10% below the day’s closing price. And within a second, it was already higher.
Could one have acquired the TNSRUSDT pair at the commencement of trading and made gains? This query will likely be posed by many who have never ventured to purchase or vend a new token in the initial moments of listing.
It’s probable that you won’t even catch sight of the initial seconds of trading. The terminal might lag due to the substantial number of traders striving to swiftly execute a transaction. Even if all transpires flawlessly and you manage to refresh the page instantly, you won’t be able to place an order promptly.
However, things could get even worse! You submit a market order, and in those split seconds (or seconds) until it executes, the price could surge significantly, resulting in substantial slippage. Subsequently, the price also sharply declines. And you, with surprise, realize that instead of a simple and understandable profit, you’re already facing a significant loss on the trade.
All the information mentioned above is specifically relevant to scalping. For investors, attempting to purchase a large volume of a new token in the first few seconds or minutes of trading is highly likely to lead to even greater slippage and losses.
Hence, for the investigation of the entry point, the closing of the first trading day is selected. This is a time when volatility decreases, allowing us to make a trade without the risk of substantial slippage.
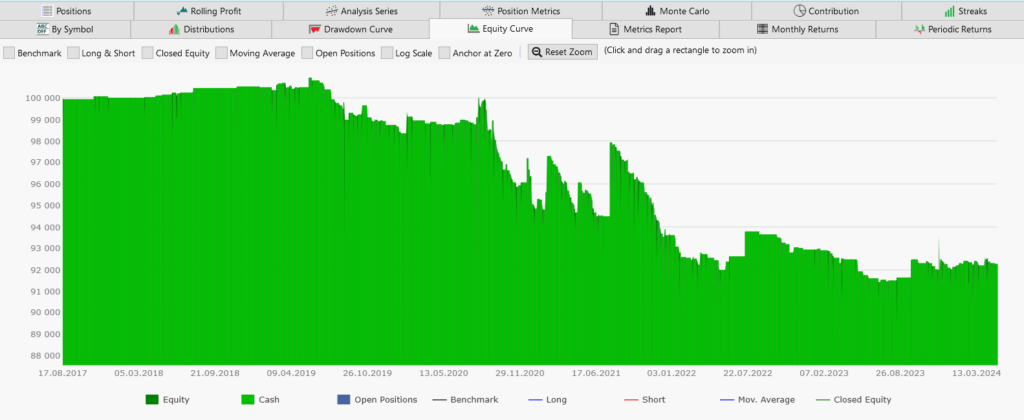
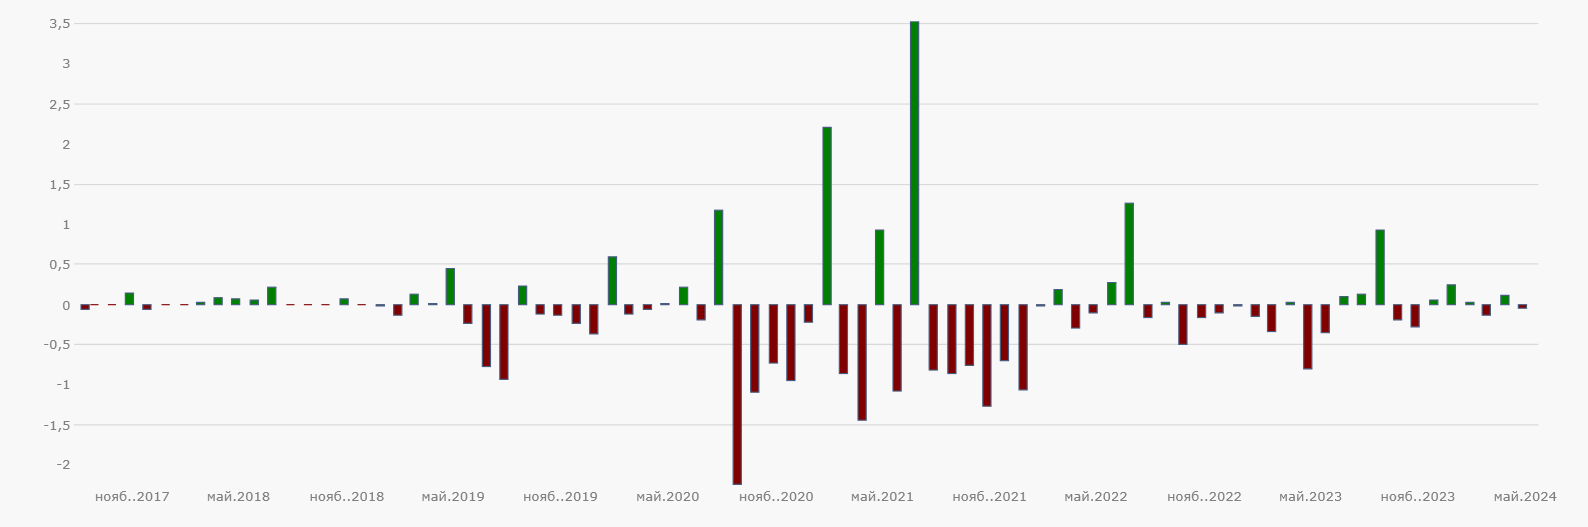
Backtest 1: Entering at the close of the first listing day. Exiting at the close of the second day. Each position is held for 24 hours.
Entering each trade with a fixed lot of $1,000.
Results
| Days | AvgProfitPct | Profit | MaxDrawdown | RecoveryFactor | PositionCount |
| 1 | -1,76 | -7746 | -9542 | -0,81 | 441 |
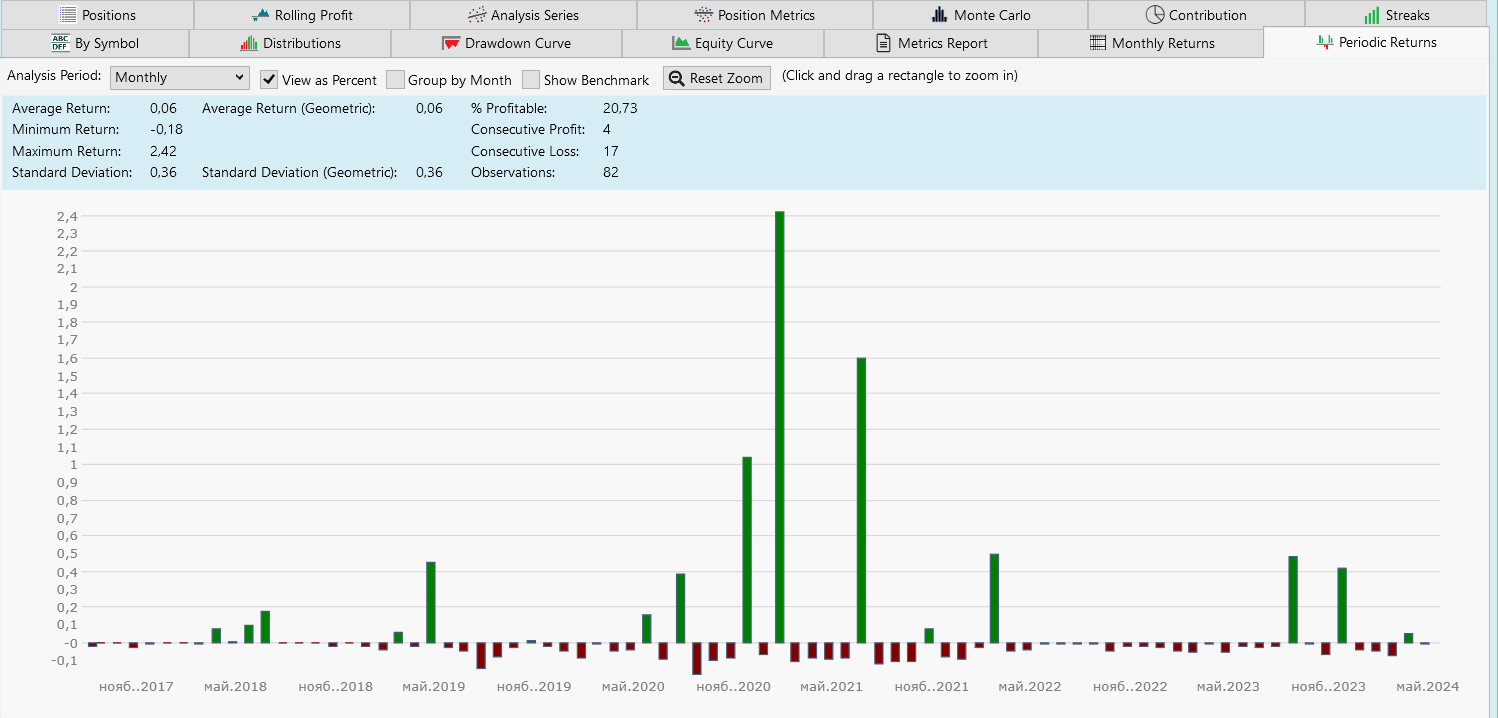
Monthly Returns
Top 10 gainers 10 losers
| Position | Symbol | Entry Date | Entry Price | Exit Date | Exit Price | Profit | Profit % |
| Long | DEXEUSDT | 24.07.2021 | 7,17 | 25.07.2021 | 19,52 | 9165 | 172,38 |
| Long | C98USDT | 24.07.2021 | 0,75 | 25.07.2021 | 2,01 | 9017 | 169,59 |
| Long | SFPUSDT | 09.02.2021 | 1,29 | 10.02.2021 | 3,46 | 10275 | 168,46 |
| Long | LEVERUSDT | 14.07.2022 | 0,00 | 15.07.2022 | 0,00 | 4867 | 118,28 |
| Long | GRTUSDT | 18.12.2020 | 0,12 | 19.12.2020 | 0,26 | 7327 | 112,98 |
| Long | UNIUSDT | 18.09.2020 | 3,46 | 19.09.2020 | 6,90 | 7872 | 99,32 |
| Long | WRXUSDT | 06.02.2020 | 0,07 | 07.02.2020 | 0,12 | 7139 | 84,93 |
| Long | LITUSDT | 05.02.2021 | 3,06 | 06.02.2021 | 5,50 | 4503 | 79,70 |
| Long | SLPUSDT | 01.05.2021 | 0,22 | 02.05.2021 | 0,36 | 3714 | 67,91 |
| Long | CREAMUSDT | 23.09.2023 | 11,40 | 24.09.2023 | 17,55 | 1991 | 53,95 |
| Position | Symbol | Entry Date | Entry Price | Exit Date | Exit Price | Profit | Profit % |
| Long | REEFUSDT | 30.12.2020 | 0,02 | 31.12.2020 | 0,01 | -3392 | -51,29 |
| Long | HFTUSDT | 08.11.2022 | 1,03 | 09.11.2022 | 0,63 | -1705 | -39,14 |
| Long | AVAXUSDT | 23.09.2020 | 5,33 | 24.09.2020 | 3,53 | -2826 | -33,74 |
| Long | ATAUSDT | 08.06.2021 | 1,51 | 09.06.2021 | 1,02 | -1860 | -32,59 |
| Long | FLMUSDT | 29.09.2020 | 0,95 | 30.09.2020 | 0,65 | -2573 | -32,38 |
| Long | WINGUSDT | 17.09.2020 | 92,50 | 18.09.2020 | 62,65 | -2642 | -32,26 |
| Long | 1INCHUSDT | 26.12.2020 | 2,30 | 27.12.2020 | 1,60 | -2084 | -30,44 |
| Long | STXUSDT | 26.10.2019 | 0,38 | 27.10.2019 | 0,26 | -2901 | -30,32 |
| Long | TWTUSDT | 28.01.2021 | 0,43 | 29.01.2021 | 0,30 | -1770 | -30,22 |
| Long | OGUSDT | 31.12.2020 | 8,92 | 01.01.2021 | 6,28 | -1867 | -29,66 |
Conclusion. Entering at the close of the first listing day and exiting at the close of the second day is a poor strategy. The average trade results in a loss of 1.76%.
Backtest 2: Entry at the close of the first listing day. Exit at the close of the third listing day. Position held for 48 hours.
Results
| Days | AvgProfitPct | Profit | MaxDrawdown | RecoveryFactor | PositionCount |
| 2 | -3,56 | -15696 | -17354 | -0,90 | 441 |
Monthly Returns
Top 10 gainers 10 losers
| Position | Symbol | Entry Date | Entry Price | Exit Date | Exit Price | Profit | Profit % |
| Long | GRTUSDT | 18.12.2020 | 0,12 | 20.12.2020 | 0,48 | 2890 | 289,58 |
| Long | LEVERUSDT | 14.07.2022 | 0,00 | 16.07.2022 | 0,00 | 1714 | 172,73 |
| Long | DEXEUSDT | 24.07.2021 | 7,17 | 26.07.2021 | 17,35 | 1422 | 142,16 |
| Long | LITUSDT | 05.02.2021 | 3,06 | 07.02.2021 | 7,38 | 1411 | 141,09 |
| Long | BURGERUSDT | 01.05.2021 | 10,09 | 03.05.2021 | 20,71 | 1055 | 105,25 |
| Long | SFPUSDT | 09.02.2021 | 1,29 | 11.02.2021 | 2,48 | 920 | 92,04 |
| Long | C98USDT | 24.07.2021 | 0,75 | 26.07.2021 | 1,43 | 916 | 91,62 |
| Long | BAKEUSDT | 01.05.2021 | 4,31 | 03.05.2021 | 8,13 | 889 | 88,78 |
| Long | MANAUSDT | 07.08.2020 | 0,06 | 09.08.2020 | 0,10 | 769 | 77,31 |
| Long | WRXUSDT | 06.02.2020 | 0,07 | 08.02.2020 | 0,11 | 716 | 71,55 |
| Position | Symbol | Entry Date | Entry Price | Exit Date | Exit Price | Profit | Profit % |
| Long | STXUSDT | 26.10.2019 | 0,38 | 28.10.2019 | 0,21 | -432 | -43,19 |
| Long | HFTUSDT | 08.11.2022 | 1,03 | 10.11.2022 | 0,58 | -435 | -43,48 |
| Long | SANTOSUSDT | 02.12.2021 | 10,40 | 04.12.2021 | 5,82 | -440 | -44,05 |
| Long | SUSHIUSDT | 02.09.2020 | 8,81 | 04.09.2020 | 4,86 | -448 | -44,81 |
| Long | JUVUSDT | 22.12.2020 | 25,38 | 24.12.2020 | 13,87 | -457 | -45,36 |
| Long | SHIBUSDT | 11.05.2021 | 0,00 | 13.05.2021 | 0,00 | -476 | -47,61 |
| Long | BOMEUSDT | 17.03.2024 | 0,02 | 19.03.2024 | 0,01 | -488 | -48,85 |
| Long | BELUSDT | 16.09.2020 | 6,22 | 18.09.2020 | 3,02 | -516 | -51,51 |
| Long | PSGUSDT | 22.12.2020 | 30,00 | 24.12.2020 | 14,04 | -533 | -53,20 |
| Long | 1INCHUSDT | 26.12.2020 | 2,30 | 28.12.2020 | 1,06 | -538 | -53,83 |
Conclusion. Entering at the close of the first listing day and exiting at the close of the third day yielded even worse results. The average trade results in a loss of 3.56%.
Summary results for days 1-30.
I won’t bore you with tests for each day. I’ll simply say that the results continue to worsen until day 15. Buying on the first listing day and exiting the position after 15 days results in an average loss of 8.57%.
Afterward, from day 15 to day 30, an improvement sets in. For example, if we purchase at the closing price on the 15th day after listing and sell after 24 hours, at the close of the 16th day, we achieve an average profit of 0.37% per trade.
| Days | AvgProfitPct | Profit | MaxDrawdown | RecoveryFactor | PositionCount |
| 1 | -1,76 | -7746 | -9542,16 | -0,81 | 441 |
| 2 | -3,56 | -15696 | -17353,72 | -0,90 | 441 |
| 3 | -3,18 | -14020 | -16315,30 | -0,86 | 441 |
| 4 | -4,82 | -21227 | -22579,52 | -0,94 | 441 |
| 5 | -5,70 | -25084 | -27622,93 | -0,91 | 441 |
| 6 | -6,43 | -28301 | -30858,09 | -0,92 | 441 |
| 7 | -5,80 | -25561 | -27708,02 | -0,92 | 441 |
| 8 | -5,83 | -25669 | -28598,41 | -0,90 | 441 |
| 9 | -5,56 | -24503 | -27846,17 | -0,88 | 441 |
| 10 | -6,13 | -26971 | -29898,08 | -0,90 | 441 |
| 11 | -6,64 | -29235 | -31727,90 | -0,92 | 441 |
| 12 | -7,23 | -31842 | -35122,00 | -0,91 | 441 |
| 13 | -8,03 | -35324 | -37606,42 | -0,94 | 441 |
| 14 | -7,75 | -34101 | -38296,85 | -0,89 | 441 |
| 15 | -8,57 | -37719 | -41902,43 | -0,90 | 441 |
| 16 | -8,24 | -36237 | -39152,88 | -0,93 | 441 |
| 17 | -7,54 | -33153 | -36675,40 | -0,90 | 441 |
| 18 | -8,34 | -36685 | -38862,14 | -0,94 | 441 |
| 19 | -7,68 | -33771 | -36593,76 | -0,92 | 441 |
| 20 | -6,28 | -27596 | -31414,09 | -0,88 | 441 |
| 21 | -5,78 | -25379 | -31042,13 | -0,82 | 441 |
| 22 | -5,15 | -22587 | -32081,42 | -0,70 | 441 |
| 23 | -3,96 | -17326 | -30745,12 | -0,56 | 441 |
| 24 | -4,27 | -18707 | -31264,39 | -0,60 | 441 |
| 25 | -4,05 | -17687 | -32920,73 | -0,54 | 441 |
| 26 | -5,26 | -23034 | -32981,14 | -0,70 | 441 |
| 27 | -5,32 | -23295 | -35319,29 | -0,66 | 441 |
| 28 | -5,64 | -24688 | -37691,08 | -0,66 | 441 |
| 29 | -5,49 | -24033 | -37060,68 | -0,65 | 441 |
| 30 | -4,19 | -18258 | -32433,39 | -0,56 | 441 |
Is there a logical explanation for why the price drops during the first 15 days after listing?
I believe there are several reasons:
*Buy on expectations, sell on news. Insiders and smart money acquire tokens shortly before the listing and immediately cash out after, securing profits.
*Early investors, including funds, exit their positions in the initial days after the listing on Binance. Firstly, they’ve already received their returns. Secondly, see the point below.
*Early investors require increased trading volume to close their positions. In the first 2 weeks after listing, there is a surge in trading volume. Refer to the weekly chart. Pay attention to the volumes of the weekly candles.
https://cryptotradinglab.com/screener/binance/spot/listingdate
This is why we see significant selling volumes and price decreases in the initial 2 weeks after listing. Eventually, sales decrease, demand starts to exceed supply, and the price moves upwards.
Can the results of this strategy (buying at the close of the first day) be improved?
Since there’s high volatility in the early days post-listing, it’s logical to place a tight stop-loss near the entry point. This ensures that we won’t incur significant losses if the price moves against us.
I decided to conduct a backtest with a 1% stop-loss.
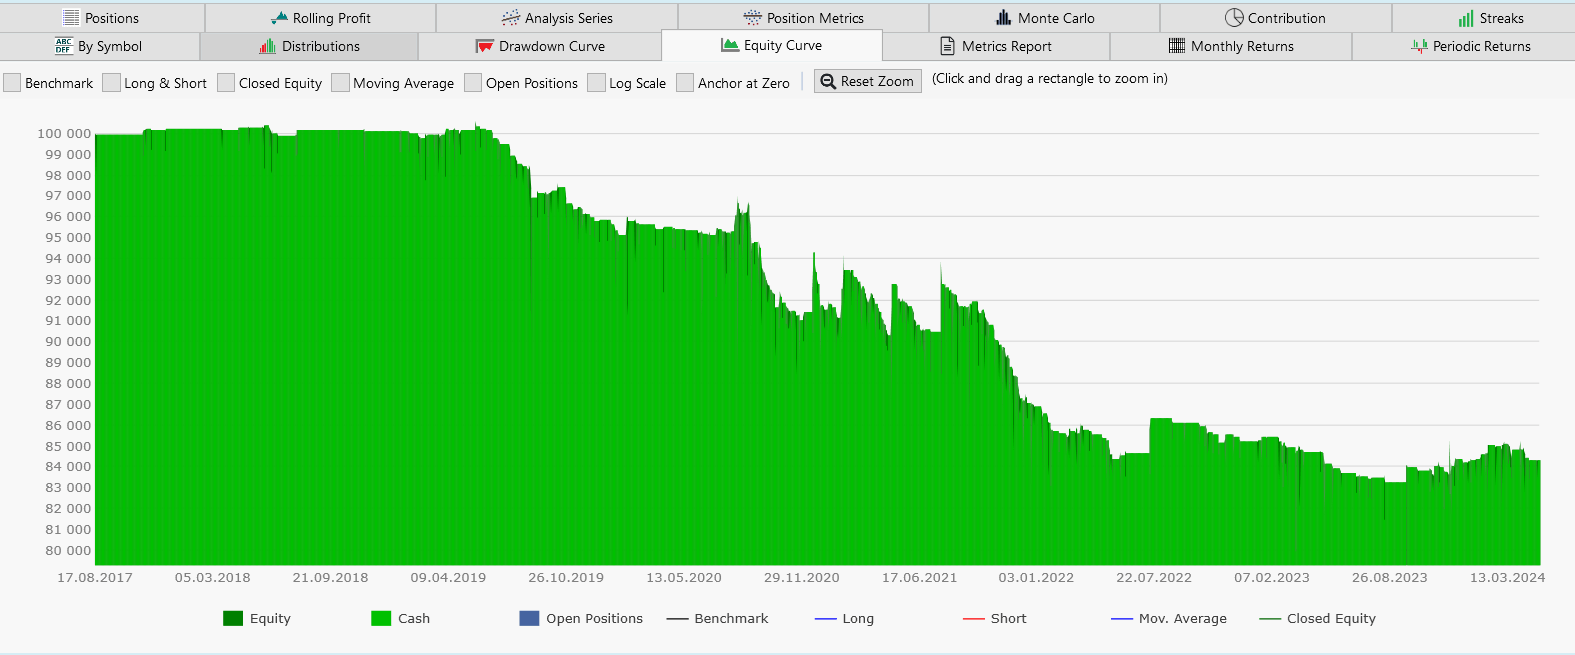
Backtest 3: Entry at the close of the first listing day. Exit at the close of the second day or at a 1% stop-loss. Position held for 24 hours.
| Days | Profit | Avg Profit % | PositionCount | MaxDrawdown | RecoveryFactor |
| 1 | 5128 | 1,16 | 441 | -602 | 8,52 |
Results
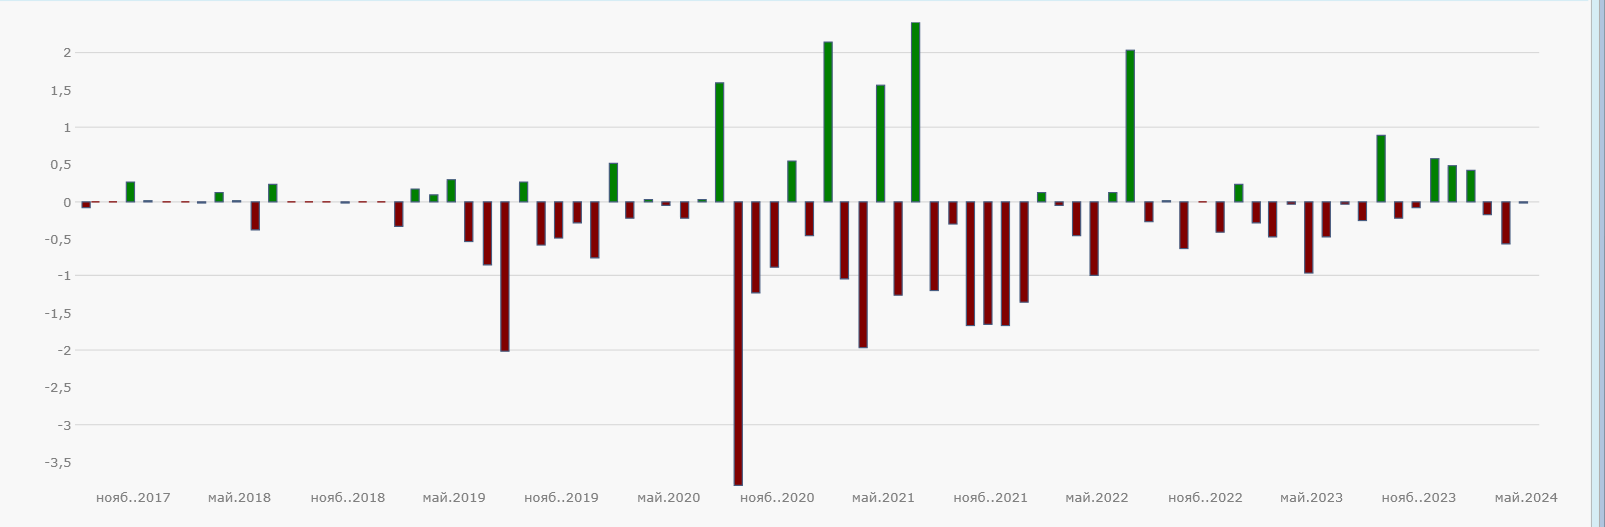
Monthly Returns
Top 10 gainers
| Position | Symbol | Entry Date | Entry Price | Exit Date | Exit Price | Profit | Profit % |
| Long | C98USDT | 24.07.2021 | 0,75 | 25.07.2021 | 2,01 | 1696 | 169,59 |
| Long | SFPUSDT | 09.02.2021 | 1,29 | 10.02.2021 | 3,46 | 1684 | 168,46 |
| Long | GRTUSDT | 18.12.2020 | 0,12 | 19.12.2020 | 0,26 | 1128 | 112,98 |
| Long | LITUSDT | 05.02.2021 | 3,06 | 06.02.2021 | 5,50 | 797 | 79,70 |
| Long | CREAMUSDT | 23.09.2023 | 11,40 | 24.09.2023 | 17,55 | 536 | 53,95 |
| Long | APEUSDT | 18.03.2022 | 8,52 | 19.03.2022 | 13,08 | 535 | 53,54 |
| Long | JTOUSDT | 08.12.2023 | 2,39 | 09.12.2023 | 3,58 | 495 | 49,55 |
| Long | TFUELUSDT | 25.05.2019 | 0,02 | 26.05.2019 | 0,02 | 450 | 44,98 |
| Long | MANAUSDT | 07.08.2020 | 0,06 | 08.08.2020 | 0,07 | 293 | 29,50 |
| Long | RGTUSDT | 06.11.2021 | 40,30 | 07.11.2021 | 49,56 | 230 | 22,98 |
We can see that the situation has changed drastically. Instead of a loss of $7,746, a profit of $5,128 was obtained. Without using a stop-loss, the average trade resulted in a 1.76% loss. With a stop-loss, the average profit per trade was 1.16%. However, the number of profitable trades decreased from 30.61% to 7.48%. While almost every third trade was positive before, now it’s only about every thirteenth.
The immediate question arises: What happens if instead of a 1% stop-loss, we use a 2%, 3%, and so on?
Backtest 4: Entry at the close of the first listing day. Exit at the close of the second day or at a stop-loss of 1%-10%.
| Stop-Loss % | AvgProfitPct | Profit | MaxDrawdown | RecoveryFactor | PositionCount |
| 1 | 1,16 | 5128 | -602 | 8,52 | 441 |
| 2 | 0,67 | 2951 | -1712 | 1,72 | 441 |
| 3 | 0,38 | 1677 | -2067 | 0,81 | 441 |
| 4 | -0,14 | -633 | -2869 | -0,22 | 441 |
| 5 | -0,10 | -461 | -2614 | -0,18 | 441 |
| 6 | -0,42 | -1859 | -3284 | -0,57 | 441 |
| 7 | -0,19 | -863 | -3799 | -0,23 | 441 |
| 8 | -0,57 | -2519 | -4562 | -0,55 | 441 |
| 9 | -0,90 | -3980 | -5001 | -0,80 | 441 |
| 10 | -1,00 | -4423 | -5324 | -0,83 | 441 |
The results get worse.
With a stop-loss of 2%, the average profit per trade drops to 0.67%.
With a stop-loss of 3%, the average profit drops to 0.38%.
With a stop-loss of 4% or more, the average profit becomes negative.
Conclusion: As the stop-loss size increases, the results deteriorate.
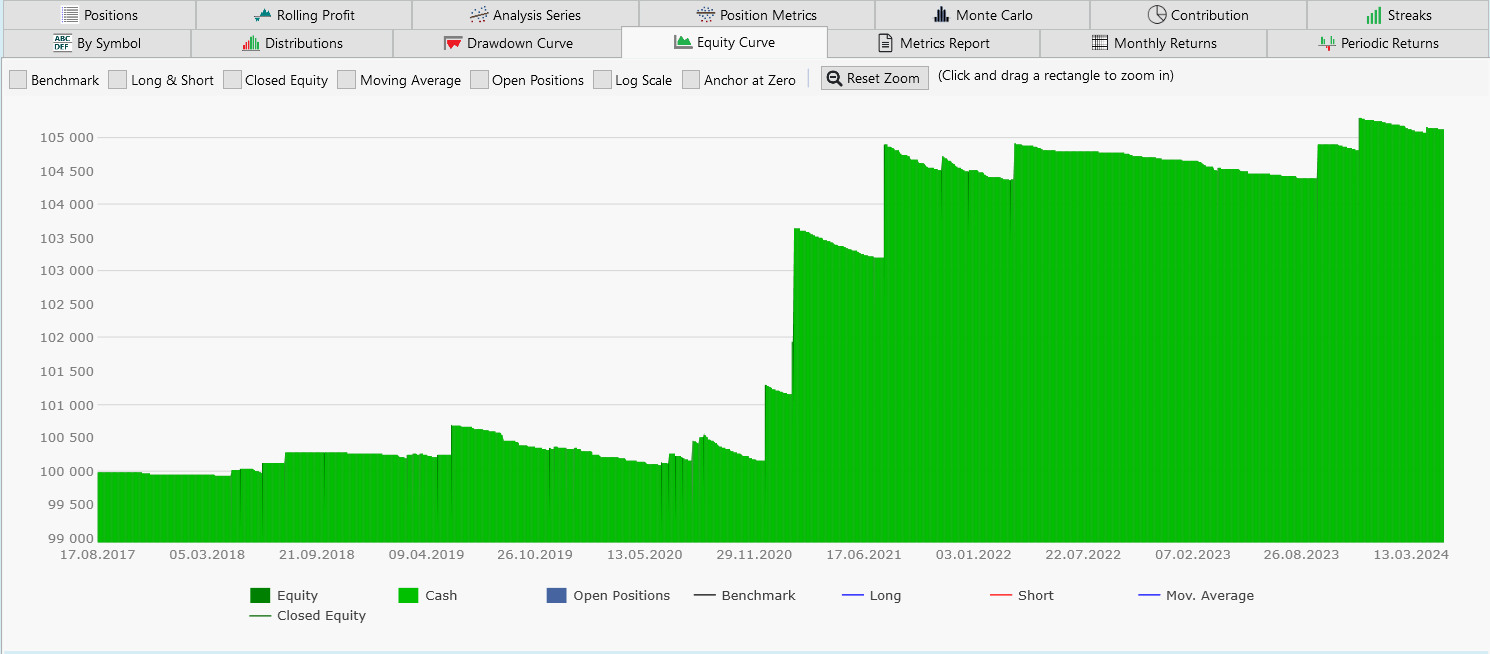
What if we keep the stop-loss at 1% and hold the position from 1 to 30 days after the listing day?
Backtest 5: Entry at the close of the first listing day. Exit at the close of days 2-30 or at a 1% stop-loss.
| Days | Stop-Loss | Profit | AvgProfitPct | RecoveryFactor | PositionCount | MaxDrawdown |
| 1 | 1 | 5128 | 1,16 | 8,52 | 441 | -602,01 |
| 2 | 1 | 5314 | 1,21 | 3,38 | 441 | -1573,98 |
| 3 | 1 | 7308 | 1,66 | 3,47 | 441 | -2103,74 |
| 4 | 1 | 4658 | 1,06 | 2,02 | 441 | -2311,16 |
| 5 | 1 | 5174 | 1,18 | 2,38 | 441 | -2169,36 |
| 6 | 1 | 3781 | 0,86 | 1,35 | 441 | -2798,13 |
| 7 | 1 | 4355 | 0,99 | 1,55 | 441 | -2810,59 |
| 8 | 1 | 3977 | 0,90 | 1,23 | 441 | -3233,04 |
| 9 | 1 | 5809 | 1,32 | 1,87 | 441 | -3113,86 |
| 10 | 1 | 5568 | 1,26 | 1,79 | 441 | -3113,86 |
| 11 | 1 | 5687 | 1,29 | 1,83 | 441 | -3113,86 |
| 12 | 1 | 5117 | 1,16 | 1,64 | 441 | -3113,86 |
| 13 | 1 | 4530 | 1,03 | 1,45 | 441 | -3113,86 |
| 14 | 1 | 4073 | 0,93 | 1,23 | 441 | -3299,27 |
| 15 | 1 | 3439 | 0,78 | 1,07 | 441 | -3229,06 |
| 16 | 1 | 3381 | 0,77 | 0,97 | 441 | -3491,11 |
| 17 | 1 | 2903 | 0,66 | 0,78 | 441 | -3719,77 |
| 18 | 1 | 2174 | 0,49 | 0,60 | 441 | -3651,75 |
| 19 | 1 | 1751 | 0,40 | 0,47 | 441 | -3719,31 |
| 20 | 1 | 1925 | 0,44 | 0,51 | 441 | -3756,13 |
| 21 | 1 | 2131 | 0,48 | 0,58 | 441 | -3651,75 |
| 22 | 1 | 3125 | 0,71 | 0,86 | 441 | -3651,75 |
| 23 | 1 | 2711 | 0,62 | 0,74 | 441 | -3651,75 |
| 24 | 1 | 1987 | 0,45 | 0,54 | 441 | -3651,75 |
| 25 | 1 | 1503 | 0,34 | 0,40 | 441 | -3786,16 |
| 26 | 1 | 2323 | 0,53 | 0,60 | 441 | -3895,56 |
| 27 | 1 | 2827 | 0,64 | 0,74 | 441 | -3842,05 |
| 28 | 1 | 3530 | 0,80 | 0,92 | 441 | -3842,05 |
| 29 | 1 | 3856 | 0,88 | 1,00 | 441 | -3842,05 |
| 30 | 1 | 5164 | 1,17 | 1,34 | 441 | -3842,05 |
Conclusion: Exiting the trade on any of the following 30 days allows us to make a profit. However, compared to exiting after 1 day from the listing day, the results worsen. You can see them below.
What else can we do?
From the above backtests, we remember that if we don’t set a stop-loss, then after 15 days post-listing, the average loss per trade is 8.57%.
Then, from day 15 to 30, an improvement occurs. For instance, if we buy at the closing price 15 days after the listing and sell after 24 hours, at the close of day 16, we achieve an average profit of 0.37% per trade.
But what if we buy at the closing price 15 days after the listing and exit not after 1 day, but later? For example, after 2, 7, 30 days?
Backtest 6: Entry at the close of 15 days post-listing. Exit after 1-30 days.
| Days | Profit | AvgProfitPct | RecoveryFactor | PositionCount | MaxDrawdown |
| 1 | 1617 | 0,37 | 1,07 | 440 | -1504,91 |
| 2 | 4909 | 1,11 | 2,74 | 440 | -1792,98 |
| 3 | 923 | 0,21 | 0,28 | 440 | -3293,02 |
| 4 | 542 | 0,12 | 0,12 | 440 | -4421,32 |
| 5 | 2491 | 0,56 | 0,55 | 440 | -4495,16 |
| 6 | 2217 | 0,49 | 0,42 | 440 | -5322,61 |
| 7 | 3335 | 0,76 | 0,57 | 440 | -5867,90 |
| 8 | 8490 | 1,92 | 1,09 | 440 | -7818,47 |
| 9 | 9604 | 2,17 | 1,17 | 440 | -8215,34 |
| 10 | 9913 | 2,23 | 1,00 | 440 | -9865,96 |
| 11 | 5869 | 1,31 | 0,59 | 440 | -9985,70 |
| 12 | 3528 | 0,78 | 0,33 | 440 | -10541,21 |
| 13 | -190 | -0,07 | -0,02 | 440 | -11786,23 |
| 14 | 699 | 0,13 | 0,06 | 440 | -11589,65 |
| 15 | 5355 | 1,19 | 0,47 | 440 | -11278,46 |
| 16 | 4596 | 1,01 | 0,41 | 440 | -11230,96 |
| 17 | 5818 | 1,29 | 0,51 | 440 | -11399,24 |
| 18 | 5744 | 1,29 | 0,48 | 440 | -12038,13 |
| 19 | 5592 | 1,25 | 0,44 | 440 | -12630,97 |
| 20 | 5626 | 1,25 | 0,41 | 440 | -13679,68 |
| 21 | 8561 | 1,92 | 0,63 | 440 | -13648,97 |
| 22 | 9589 | 2,15 | 0,69 | 440 | -13835,20 |
| 23 | 5968 | 1,32 | 0,42 | 440 | -14240,22 |
| 24 | 10056 | 2,24 | 0,69 | 440 | -14530,77 |
| 25 | 8019 | 1,78 | 0,52 | 440 | -15455,64 |
| 26 | 12255 | 2,75 | 0,75 | 440 | -16270,60 |
| 27 | 12357 | 2,77 | 0,74 | 440 | -16759,67 |
| 28 | 14212 | 3,19 | 0,82 | 440 | -17243,62 |
| 29 | 13593 | 3,04 | 0,79 | 440 | -17283,12 |
| 30 | 16330 | 3,66 | 0,93 | 440 | -17596,12 |
Conclusion: Buying at the close of 15 days post-listing and exiting within the following 30 days yields profit. Exiting exactly after 30 days results in an average profit per trade of 3.66%.
What if we add a 1% stop-loss for exiting the trade?
Backtest 7: Entry at the close of 15 days post-listing. Exit after 1-30 days or at a 1% stop-loss.
| Days | Stop-Loss | Profit | AvgProfitPct | RecoveryFactor | PositionCount | MaxDrawdown |
| 1 | 1 | -1101 | -0,25 | -0,89 | 440 | -1236,21 |
| 2 | 1 | -635 | -0,15 | -0,48 | 440 | -1322,56 |
| 3 | 1 | -1128 | -0,26 | -0,79 | 440 | -1421,71 |
| 4 | 1 | -1218 | -0,28 | -0,79 | 440 | -1539,56 |
| 5 | 1 | -856 | -0,20 | -0,64 | 440 | -1343,92 |
| 6 | 1 | -1609 | -0,37 | -1,00 | 440 | -1609,08 |
| 7 | 1 | -1853 | -0,42 | -1,00 | 440 | -1852,54 |
| 8 | 1 | -2198 | -0,50 | -1,00 | 440 | -2197,59 |
| 9 | 1 | -2659 | -0,61 | -1,00 | 440 | -2658,86 |
| 10 | 1 | -2579 | -0,59 | -1,00 | 440 | -2579,48 |
| 11 | 1 | -2397 | -0,55 | -1,00 | 440 | -2396,77 |
| 12 | 1 | -3028 | -0,69 | -1,00 | 440 | -3028,46 |
| 13 | 1 | -2731 | -0,62 | -1,00 | 440 | -2730,77 |
| 14 | 1 | -2854 | -0,65 | -0,99 | 440 | -2874,84 |
| 15 | 1 | -3108 | -0,71 | -1,00 | 440 | -3108,20 |
| 16 | 1 | -3397 | -0,77 | -1,00 | 440 | -3396,96 |
| 17 | 1 | -3308 | -0,75 | -1,00 | 440 | -3308,16 |
| 18 | 1 | -3305 | -0,75 | -1,00 | 440 | -3304,90 |
| 19 | 1 | -3144 | -0,72 | -1,00 | 440 | -3144,15 |
| 20 | 1 | -3175 | -0,72 | -1,00 | 440 | -3174,75 |
| 21 | 1 | -3295 | -0,75 | -1,00 | 440 | -3294,94 |
| 22 | 1 | -3237 | -0,74 | -1,00 | 440 | -3236,55 |
| 23 | 1 | -2933 | -0,67 | -1,00 | 440 | -2932,96 |
| 24 | 1 | -2754 | -0,63 | -0,96 | 440 | -2878,09 |
| 25 | 1 | -2905 | -0,66 | -1,00 | 440 | -2904,77 |
| 26 | 1 | -3028 | -0,69 | -1,00 | 440 | -3027,83 |
| 27 | 1 | -3421 | -0,78 | -1,00 | 440 | -3421,30 |
| 28 | 1 | -3289 | -0,75 | -1,00 | 440 | -3288,77 |
| 29 | 1 | -3747 | -0,85 | -1,00 | 440 | -3747,01 |
| 30 | 1 | -3834 | -0,87 | -1,00 | 440 | -3834,41 |
Conclusion: The results worsened. Small losses were incurred everywhere.
Final Conclusions
- Purchasing new tokens in the first 2 weeks post-listing is a poor strategy, with a very negative expected value.
- Shorting these tokens, for instance, using futures, is a good strategy, especially considering the additional profit from the funding rate.
- Buying new tokens after 2 weeks post-listing and selling within 1-30 days post-purchase results in a positive expected value.